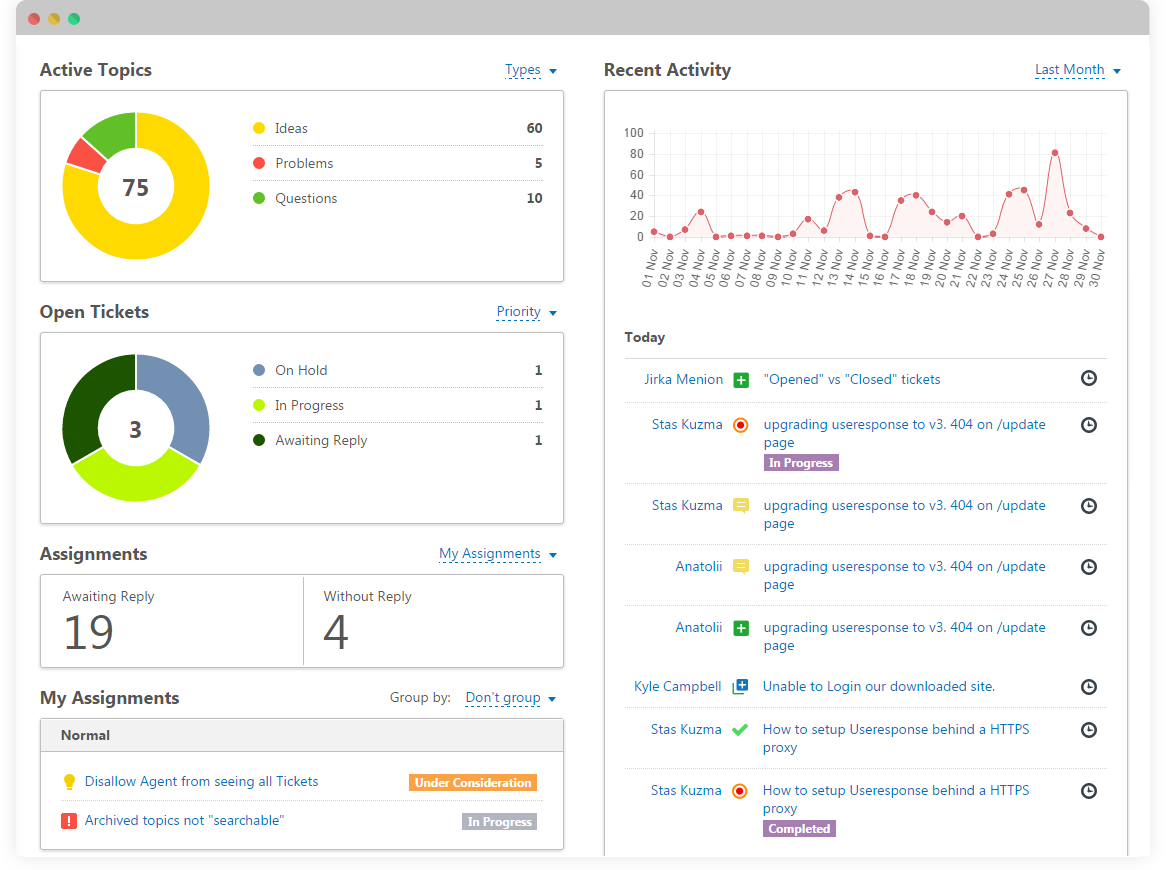
Dashboard is the place where an agent can get a quick overview of the community on active topics, open tickets, recent activity, etc in the system.

Overview of the community is represented by the following boxes:
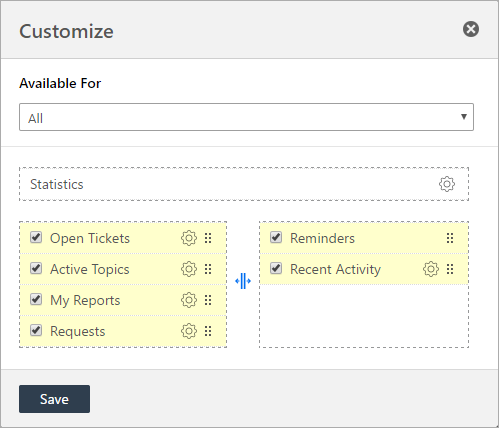
- Metrics - display required metrics on the Dashboard by going to Customize section;
- Active Topics - pie chart with the ability to filter by different parameters;
- Open Tickets - pie chart with several filter parameters;
- My Reports - shows the result of selected reports (queues) in the Requests section. Create reports and save them to choose to be displayed here. Default Value - which objects are waiting for a reply, and a number of objects with assignments.
- My Assignments - shows the list of objects that you are assigned to with the ability to group by different parameters. You can change to any list in the Customize section;
- Reminders - shows the list of all reminders on internal notes set by yourself and assigned by others;
- Recent Activity - graph and list of all activity in the community. It's very similar to the "Activity Log" page. Also, filtering could be set to show agents and users' activities.
If you want to get more details on any ticket or topic, just select the required filter and click on it. You'll be redirected to the requests page with the list of results on that filter.
Dashboard is unique for each agent. With the help of the customized interface, agents can set what options they want to see on the page. If you select the position of all boxes to be located on the right or left side, the system will display them on the full width of the page.

Any changes with filters, boxes on the page are set by the Administrator, but can be overridden individually for any support agent.
In order to get specific results on any selection, please refer to the Requests section that is also available for agents.


