UseResponse Analytics tool allows tracking key metrics on the incoming requests to ensure that customers received the highest level of support.
First, you need to enable Analytics in Administration » Applications.
By default, only Administrators of the system can manage analytic reports. That could be changed for other teams in Menu » Users by creating a new agent's team with "Manage Analytics" permission and assigning support agent to it.

Available only after subscription and it should be enabled manually in Menu » Analytics in the agent interface
Understanding of Analytic Reports
There are several analytic reports out of the box with basic metrics on team performance, forum trends, and activity in your community. The list of available reports depends on UseResponse solutions you purchased:
- Insights - provides data on the total volume of queries and the current load on your support team;
- Performance - gives you an understanding of whether your customers receive the answers in a fast and efficient way;
- Votes & Trends - lets you analyze the most active users in the community, the most popular ideas at a certain period of time and other voting trends. The report is available only with Feedback solution enabled;
- Search Insights - shows visitors search data including top search queries entered in your help center and searches that didn't give any result.
Custom Reports
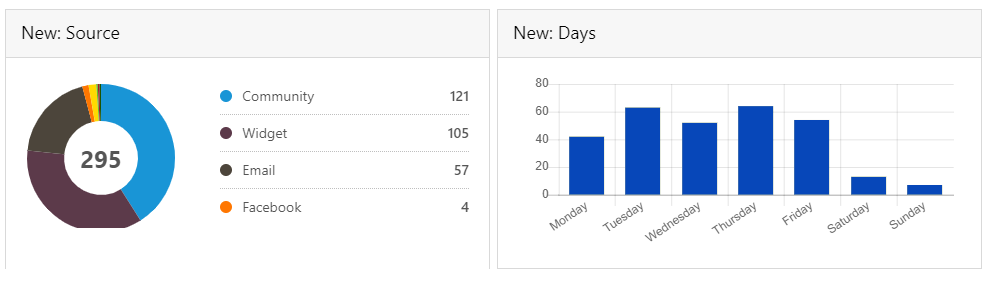
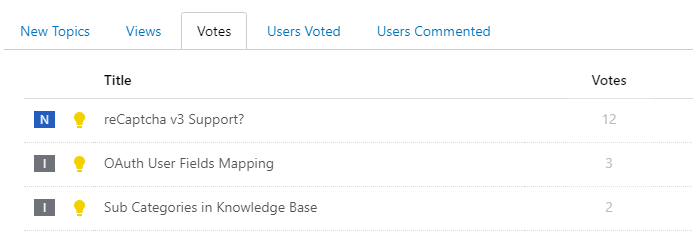
You can build own custom reports by clicking plus icon at the top left of the analytics page and selecting Analytics: Report in the list. You should specify key metrics (maximum 6 in one report), certain conditions if needed and add some graphic to visualize the data with timelines, histograms or pie charts. Once you save a new report, you'll also see the table list of requests or users to analyze metrics in details.
At the top of reports, you can find quick filters option by clicking on which you are able to set a specific reporting date range or filter requests/users on the go without any report management.
Metrics Overview
There are 3 main types of metrics - Feedback, General, Performance. Any metric from "feedback" and "performance" category can be combined with metrics in "general" category.
Feedback Metrics
Check who is a leader in providing feedback and analyze votes/activity you get in your community.
- Users Commented - the number of unique users in the community who published their comments in the selected time period;
- Users Voted - the metric counts community members who voted for ideas during the reporting period;
- Votes - the metric states how many votes you've got from end-users and internal team.
General Metrics
Provides vast data about incoming requests to see an overview of the entire support system.
- New - the number of new user requests (tickets, topics, chat conversations) created during a stated period of time;
- Completed - the number of solved issues during the reporting date range;
- Backlog - the current number of issues that are not in a closed state yet;
- Unassigned - the current count of unsolved requests that haven't been assigned to any agent in the team;
- Requires Agent Reply - the current amount of open requests where the last comment or message was left by a customer;
- With Replies - the current number of open requests that have been replied by users or agents;
- Replies - the total count of public comments for a stated period of time.
Performance Metrics
Estimate your team performance in a specific period of time and compare the increase or decrease of any team member in providing support to customers.
- First Reply Time - the amount of time between the request creation and first agent reply to the customer;
- Average Reply Time - the average time between the latest unanswered customer comment and agent reply to it;
- First Resolution Time - the period of time between the inquiry creation and the time it was first resolved;
- Full Resolution Time - the period of time between the inquiry creation and the time it was fully resolved;
- Agent Touches - the total count of public agent comments for a stated period of time;
- SLA Breaches - the count of tickets and chat dialogs where SLA metrics were violated;
- Satisfaction Rating - shows the total customer satisfaction score calculated for the whole team in the selected time period.
Metrics include trashed requests and articles.
Search Insights Metrics
These are predefined metrics displayed in Search Insights report. The report cannot be modified or deleted and available only with Knowledge Base solution enabled.
- Total Searches - the total number of end-users' search queries in your help portal;
- With Result - the count of queries that gave relevant articles or FAQs from your public online documentation;
- Without Result - the count of failed search keywords that couldn't find any matching results in the knowledge base;
- With Clicks - the number of successful searches that have been clicked by visitors;
- Without Clicks - the number of failed searches that have not been clicked by visitors;
- Success Rate - calculated as a ratio of With Clicks metric and Total Searches.