

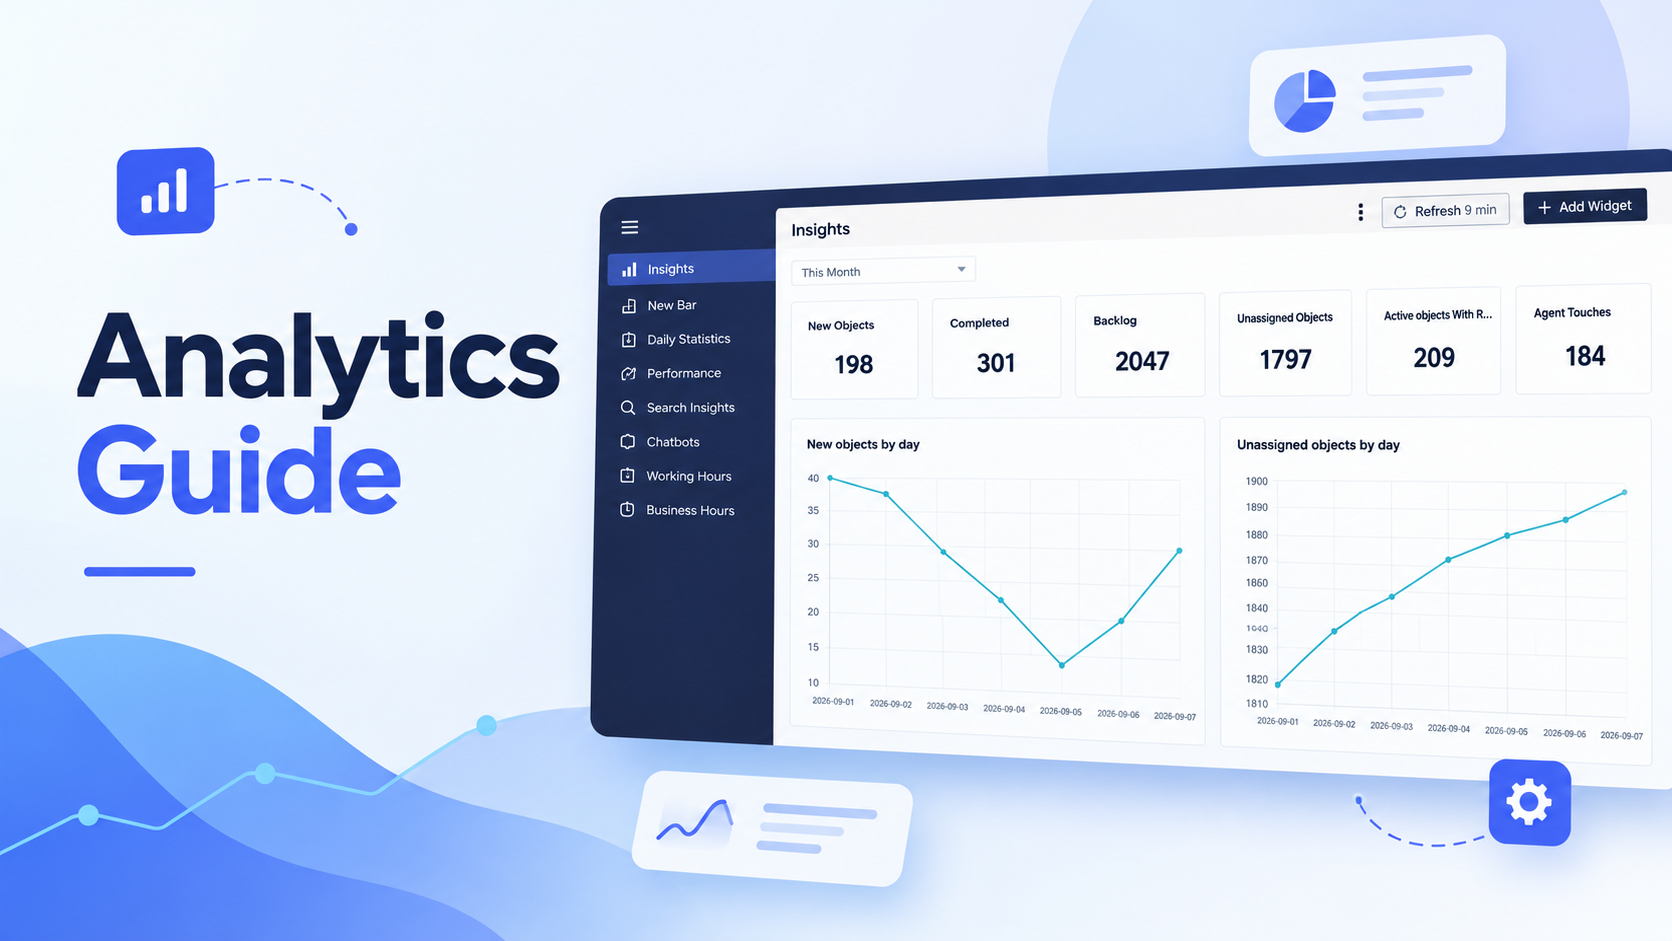
Every team needs a clear picture of what is happening in their support desk and community — how many requests are coming in, how fast the team responds, and where the bottlenecks are. Analytics is the module that turns that raw activity into reports you can act on, managed in Applications » Analytics.
Analytics is event-based: instead of just counting how things look right now, it records a snapshot of an object (a ticket, topic, article, chat, etc.) at the exact moment something happens to it — for example, when it's created, when a reply is sent, or when it's completed.
How Analytics Works
Event-Based Snapshots
When you apply a date filter to a report, you are telling Analytics which events to include, based on when they occurred — not what the object looks like today. For each matching event, Analytics shows the state of that object at the latest point within your selected time range , so you always see the most up-to-date picture available for that period.
Key Concepts
| Term | Definition |
|---|---|
| Report | A personalized dashboard that groups together multiple widgets. A report can be filtered by a date range — this filter is then applied to all widgets inside that report. |
| Widget | Displays a single Metric as a visual chart or table. Each widget has its own Metric, its own Filters, and its own Visualization type (Number, Line, Bar, Doughnut, or Table). Where applicable, data can also be grouped and sub-grouped. |
| Metric | Tracks one specific event in your help desk (a ticket being created, resolved, replied to, etc.), together with the key details of that object at the exact moment the event occurred — such as its status, assignee, or priority. |
| Filter | Narrows down which data a Report or Widget displays — by time period, team, agent, status, tags, and more — so you only see what's relevant to you. |
Default Reports
Once you enable Analytics in the Applications menu, a set of standard, ready-to-use reports appears automatically in the left-hand menu. You don't need to build these from scratch — you can start reading them right away, and personalize them later if needed.
| Report | What it shows | When it appears |
|---|---|---|
| Insights | How many support queries you're receiving and your team's current workload (New, Completed, Backlog, Unassigned, With Replies, Requires Agent Reply, and more). | Always available. |
| SLA | SLA compliance and breach tracking. | Always available. |
| Performance | How quickly and effectively customers are getting the answers they need (response and resolution times). | Always available. |
| Votes & Trends | Which users are most active in your community, which ideas are gaining traction, and emerging voting patterns. | Community-related features. |
| Search Insights | What visitors are searching for in your help center — including the most popular search terms and queries that returned no results. | Always available. |
| Chatbots | How well your chatbot is performing: user engagement throughout conversation flows, success/abandonment rates, failed or stopped sessions, and average session length. | Only if you're using Chatbots. |
| Working Hours | Team work patterns — when agents come online, go offline, take breaks, and how they manage their time. Filterable by time period, team, or individual agent. Click any time entry to see a full breakdown: each online period within the selected timeframe, what triggered the session start/end (agent or system), and which object types the agent worked with. | Only if you're using Business Hours. |
You can personalize any pre-built report to your preference, or build your own from scratch — covered next.
Metrics Reference
Every widget is built around a Metric. Think of the Metric + Filter combination as the question you want answered: How many tickets did my team complete? How many tickets do we have in each status? How much time does it take my team to respond to customers?
1. Object-Based Metrics
| Metric | What is counted | Which date places it in the period | When field values are taken |
|---|---|---|---|
| New Objects | All objects created within the selected time period. | Object creation date must fall within the selected period. | Current values, at the moment you open the report — not what they were when the object was created. This means historical numbers can change if fields were updated after the period ended. |
| Completed Objects | All objects marked Completed or Closed within the selected time period. | Completion date must fall within the selected period. | What they were at the moment of completion — an accurate historical snapshot. If an object was completed more than once in the period, only the last completion counts. Can be broken down by how the object was completed (agent, system, or user) and by assignee. |
| Active Objects | All objects in an active status (e.g. Open, Pending) at the end of the selected period. | Snapshot at the period's end date — not a count of activity during it. | What they were at the end of the selected period. |
| Unassigned Objects | Active objects that had no assignee at the end of the selected period. | Snapshot at the period's end date. | Counted only if the assignee field was empty at that point in time. |
| Assigned Objects | Active objects that had an assignee at the end of the selected period. | Snapshot at the period's end date. | Counted only if the assignee field was filled in at that point in time. |
2. Reply & Response Metrics
| Metric | What is counted | Which date places it in the period | Notes |
|---|---|---|---|
| Agent Replies Sent | Public replies sent by agents, across all object types including chats. | The reply's sent date must fall within the selected period. | Field values are taken at the moment the reply was sent. |
| Messages Sent By User | Public messages sent by users and agents combined. | The message's sent date must fall within the selected period. | A mixed (user + agent) metric. Only public messages count — internal notes are excluded. |
| Messages per Object ("With Replies") | Active objects that currently have at least one public reply. | Snapshot at the period's end date. | Shows the current number of open requests already answered by users or agents. |
| Unanswered By Agent | Active objects where the last message was from a user and no agent has replied since. | Snapshot at the period's end date. | Uses the last message author to determine whether an agent reply is still pending. |
| First Reply Time | Time from object creation to the first public reply sent by an agent. | Only objects whose first public agent reply falls within the selected period. | Only public replies count — internal notes and private messages are excluded. Objects that never received a public agent reply are not included. |
| Average Response Time | Average time between a customer message and the next public agent reply, across all interactions in the period. | All public agent replies sent within the selected period. | Each customer→agent reply interval is measured separately, then all intervals are averaged — giving a realistic picture of ongoing responsiveness, not just the first reply. |
| Assignment to First Reply | Time between an agent being assigned to an object and that agent sending their first public reply. | Only objects whose first public reply falls within the selected period. | If the first public reply was sent by someone other than the assigned agent, the object is excluded from this metric. |
| Average Assignment to Reply | Average time it takes an assigned agent to send a public reply after being assigned, across all replies in the period. | All public agent replies sent within the selected period. | Only replies sent by the assigned agent are counted — replies from non-assignees are excluded. |
| First Resolution Time | Time from object creation to its first completion. | Objects whose first completion happened within the selected period. | Field values are taken at the moment of that completion. |
| Full Resolution Time | Time from object creation to its last completion within the period. | Objects whose last completion happened within the selected period. | If an object was reopened and completed again later, it can appear again in a later period. |
3. Customer Satisfaction Metrics
| Metric | What is counted | Which date places it in the period | Notes |
|---|---|---|---|
| Average Satisfaction Survey (CSAT) | The average customer satisfaction rating submitted within the period. | Rating submitted date must fall within the selected period. | Every individual rating counts — if a customer rated the same object multiple times, each rating is included separately. |
| Completed Satisfaction Surveys | The total number of satisfaction ratings submitted within the period. | Rating submitted date must fall within the selected period. | Each submitted rating is counted individually, even multiple ratings on the same object. |
4. SLA Metrics
| Metric | What is counted | Which date places it in the period | Notes |
|---|---|---|---|
| SLA Breaches | The number of SLA breach events that occurred within the period. | The breach is recorded at the exact moment an SLA deadline is missed. | Field values reflect what they were at the moment of the breach — an accurate picture of the object's state when things went wrong. |
5. Votes Metrics
| Metric | What is counted | Which date places it in the period | Notes |
|---|---|---|---|
| Topic Votes | Votes submitted on topics (e.g. ideas) within the period. | Vote date must fall within the selected period. | Field values reflect what they were at the moment of the vote. |
| Article Votes | Votes submitted on knowledge base articles within the period. | Vote date must fall within the selected period. | Each vote captures one of three reactions: Happy, Confused, or Sad — a quick read on whether the content is landing well or needs improvement. |
Filters Reference
Filters let you narrow a widget down to exactly the slice of data you care about. Most filters apply to all metrics; a few don't make sense for certain metrics (for example, most object-level filters don't apply to Article Votes, since that metric is about articles, not tickets or topics).
| Filter | Typical options | Applies to |
|---|---|---|
| Object: Status | is / is not; Active or Completed | All metrics except Article Votes |
| Object: State | is / is not; Normal, Trashed, Archived, On Moderation | All metrics |
| Object: Tags | is / is not / is empty / is not empty | All metrics |
| Object: Type | is / is not | All metrics except Article Votes |
| Object: Created By | Anybody, Guest, Registered, Agents, Users, Selected Agent/User, Selected Team, Agent Using this Report | All metrics |
| Object: Completed By | Anybody, Guest, Registered, Agents, Users, System, Selected Agent/User, Selected Team, Agent Using this Report | All metrics except Active Objects and Article Votes |
| Object: Comments (Object Reply Status) | All Objects, With Comments, Single Public Agent Reply, Requires Agent Reply | All metrics except Article Votes |
| Object: Responsible | Anybody, Set, Not Set, Agent Using this Report, Selected Agents | All metrics except Article Votes |
| Object: Source | is / is not | All metrics except Article Votes |
| Object: Team | is / is not | All metrics except Article Votes |
| Object: SLA Rule | is / is not | All metrics except Article Votes |
| Object: Community | is / is not | All metrics |
| Ticket (custom fields) | is / is not / select | All metrics except Article Votes |
| Topic (custom fields) | is / is not / select | All metrics except Article Votes |
Visualization Types, Group By & Sub-group By
Once a Metric and its Filters are set, choose how the data should be displayed. Analytics supports five visualization types, selectable from the icon bar at the top-right of the widget preview:
| Visualization | Best for | Group By support |
|---|---|---|
Number (123)
|
A single headline value — e.g. the KPI cards at the top of the Insights report (New, Completed, Backlog, Unassigned…). | No grouping options. |
| Line | Trends over time. | No grouping options. |
| Bar | Comparing a metric across categories (teams, agents, statuses, custom fields, etc.) — and, combined with Sub-group By, breaking each category down one level further (e.g. per day, split by agent). | Group By and Sub-group By. This is the most flexible visualization for two-dimensional breakdowns. |
| Doughnut | Showing the share/proportion of each category within a metric. | Group By only. |
| Table | A detailed, sortable breakdown you can scan row by row. | No grouping selector for most object-based metrics (one row per object); reply-based metrics list one row per agent automatically. |
Where grouping is available, the dimensions offered depend on the metric, but commonly include:
- Object Type — split by ticket, topic, article, chat, etc.
- Assignee at Given Time — the agent assigned to the object at that point in time.
- Community — split by community/brand.
- Channel — the source channel of the object.
- Team / Responsible: Team — split by agent team.
- Days — split by day, useful for spotting daily patterns.
- Custom fields — Ticket or Topic custom fields, if configured.
Reply-based metrics add a few extra dimensions where relevant, such as Author, Status, and Agent: Team.
Calendar vs. Business: for time-duration metrics (First Reply Time, Average Response Time, Assignment to First Reply, Average Assignment to Reply, First/Full Resolution Time), the widget preview offers a toggle between Calendar time (24/7 clock time) and Business time (counting only the hours defined in your Working/Business Hours schedule). Use Business time if you don't want nights, weekends, or off-hours to inflate your response and resolution numbers.
Building a Report
Create a New Report
- Click + Analytics: report.
- Give your report a name.
- Add your first widget.
Separate reports let you monitor performance across different communities, object types, or agent teams without cluttering a single dashboard.
Configure a Widget
Every widget has three components you configure together:
- Metric — the data you want to track.
- Filter(s) — how you narrow the data down.
- Visualization — how the result is displayed (Number, Line, Bar, Doughnut, Table), plus Group By / Sub-group By where supported.
- Click + Add Widget on a report.
- Enter a Widget title (by default, new widgets are named after the metric — rename them so your team can tell widgets apart at a glance).
- Choose a Metric from the dropdown (see the Metrics Reference above for the full list, grouped by category).
- Click Add Filter to narrow down the data — you can stack multiple filters; all conditions must match.
- Pick the visualization icon (Number / Line / Bar / Doughnut / Table) in the top-right of the preview panel.
- Pick a Group By (and, if available, a Sub-group By) dimension if you want the data broken down further.
- For time-duration metrics, choose Calendar or Business time.
- Click Submit.
Manage Existing Widgets
Each widget has its own actions menu, available from the widget's header:
| Action | What it does |
|---|---|
| View Data | Opens the non-aggregated data points behind the widget's chart. |
| Edit | Reopens the Edit Widget panel to change the title, metric, filters, group by, or visualization. |
| Duplicate | Creates a copy of the widget — useful for building a variant with slightly different filters without starting from scratch. |
| Export | Exports the widget's data. |
| Delete | Removes the widget from the report. |
Best Practices for Building Reports
- Build one report per audience or goal — a daily workload dashboard for team leads, a monthly SLA review for management, a CSAT trend for QA — instead of one giant report mixing everything. Widgets are cheap to add; reports are what people actually open, so keep each one focused on a single question.
- Rename every widget. New widgets default to the metric's name (often literally "New"), which is meaningless once a report has more than one widget. A title like "Unassigned tickets — EU team" tells you what you're looking at without opening it.
- Use Business time, not Calendar time, for response/resolution metrics — unless you genuinely run 24/7 support. Calendar time silently punishes your team for nights and weekends and will make your response times look worse than they are.
- Pair a headline Number with a breakdown chart. A single "SLA Breaches: 12" card tells you there's a problem; a Bar or Doughnut chart grouped by Team next to it tells you where. Numbers are for status checks, charts are for diagnosis.
- Double-check "who" filters before trusting agent-level numbers. Metrics like Completed Objects or Average Assignment to Reply can include completions by the system or replies from non-assignees unless you filter
Object: Completed Byor similar to Agents / Selected Agent — otherwise a leaderboard will misrepresent individual performance.
- Trend, don't snapshot, anything you want to catch early. CSAT, backlog size, and SLA breaches are far more useful as a Line chart grouped by Days than as a single number for "This Month" — a single number tells you where you are, a trend tells you where you're heading.
Example Widgets
The five widgets below are single, self-contained answers to specific questions team leads ask most often. Each one follows the same pattern: the question → the best-practice reasoning → the exact Metric / Filters / Group By / Visualization recipe to build it as one widget.
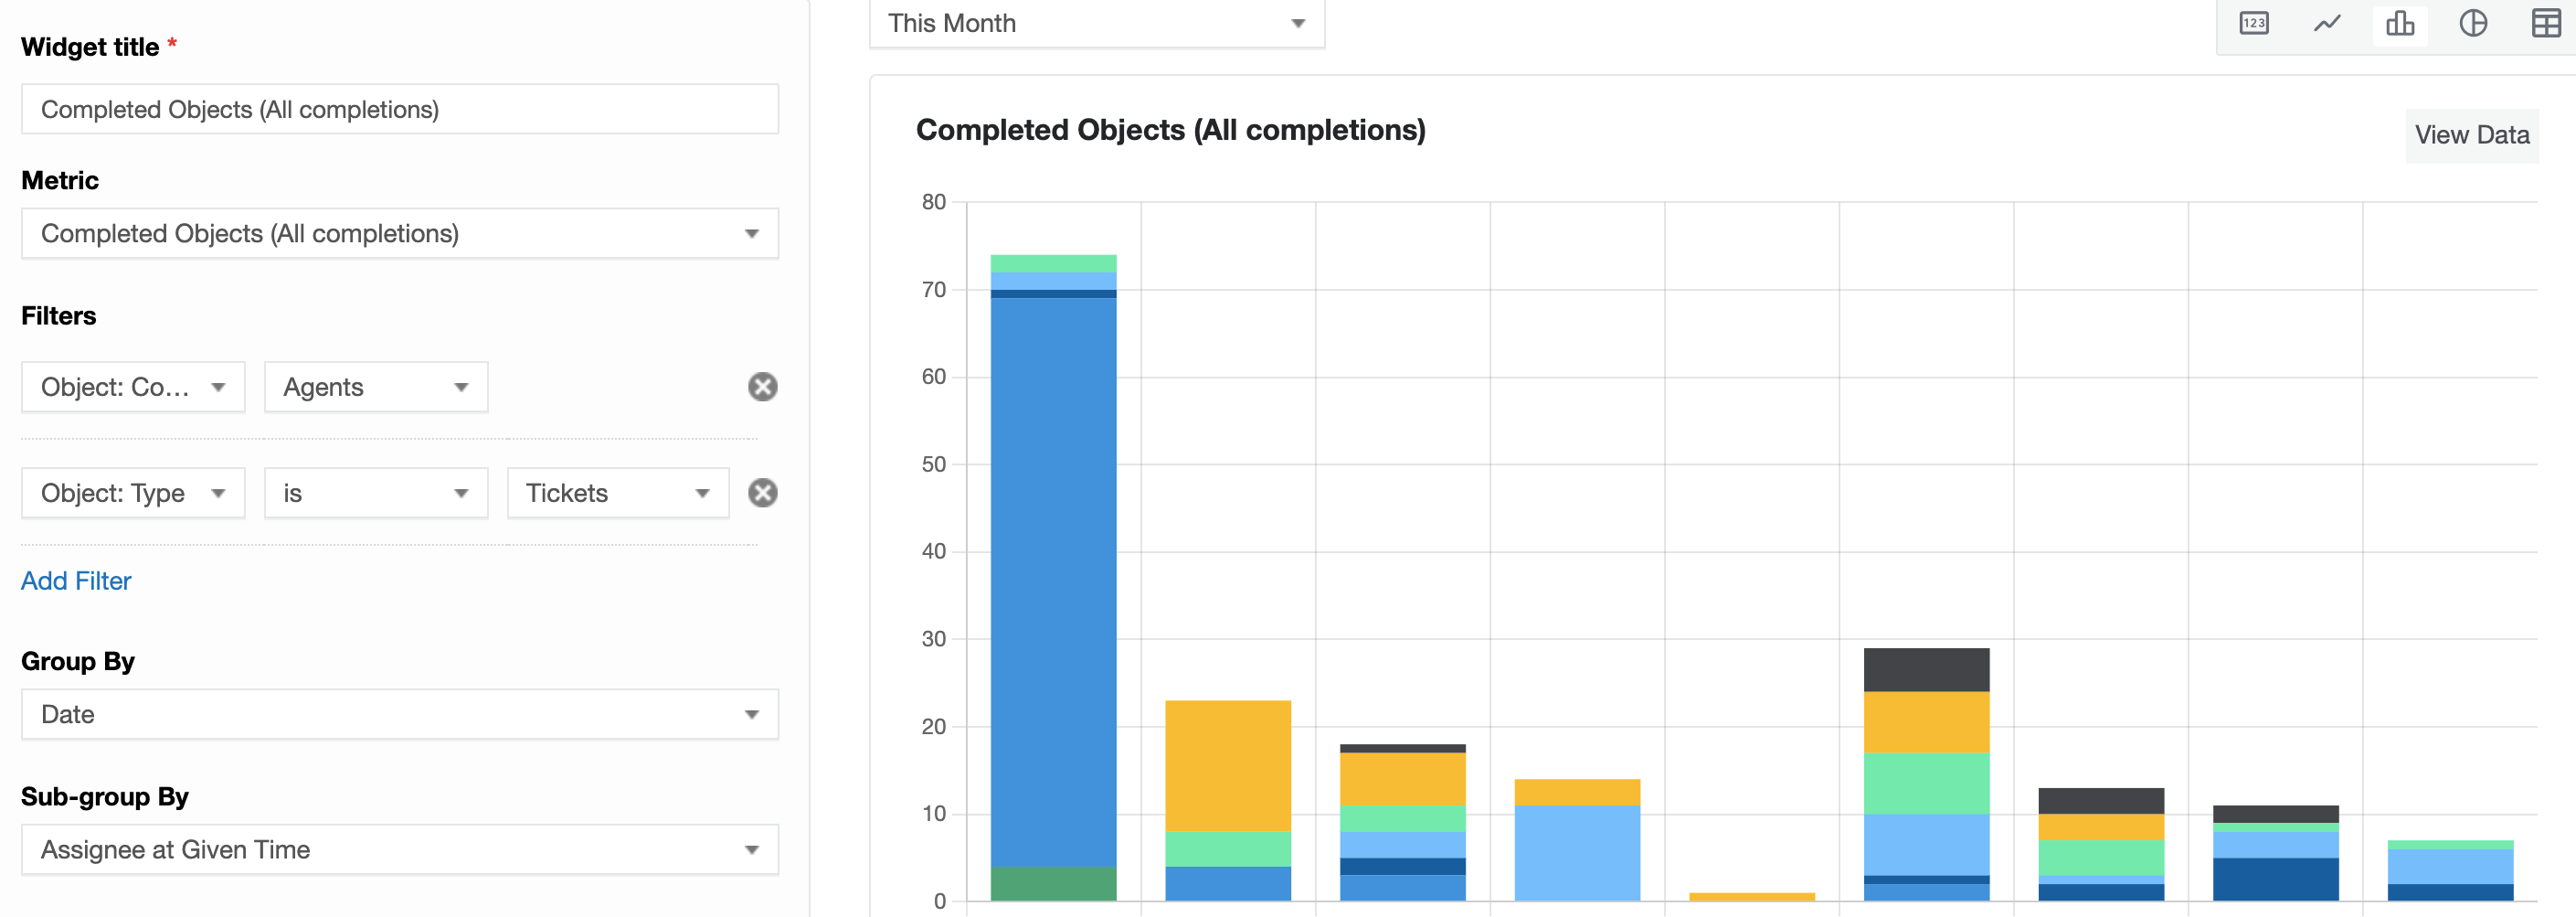
Example 1 — "How many tickets does each agent close per day?"
Best practice: filter out system auto-completions first — Metric Completed Objects without Completed By: Agents filter will count tickets the system closed automatically (e.g. after inactivity) as if an agent had handled them, inflating everyone's numbers.
Use Days as the main grouping so you get a daily trend, not a single monthly total, and Sub-group By Assignee to break each day down by agent in one chart.
| Setting | Value |
|---|---|
| Metric | Completed Objects |
| Filters | Object: Completed By is Agents; Object: Type is Ticket |
| Group By | Days |
| Sub-group By | Assignee at Given Time |
| Visualization | Bar (stacked by agent, one bar per day) |
Tip: if you only need one agent's number and don't need the daily breakdown, add a second, simpler widget: same Metric and Filters, plus filter Object: Completed by Selected Agent, visualized as a Number Card
Example 2 — "What is the average SLA per agent?"
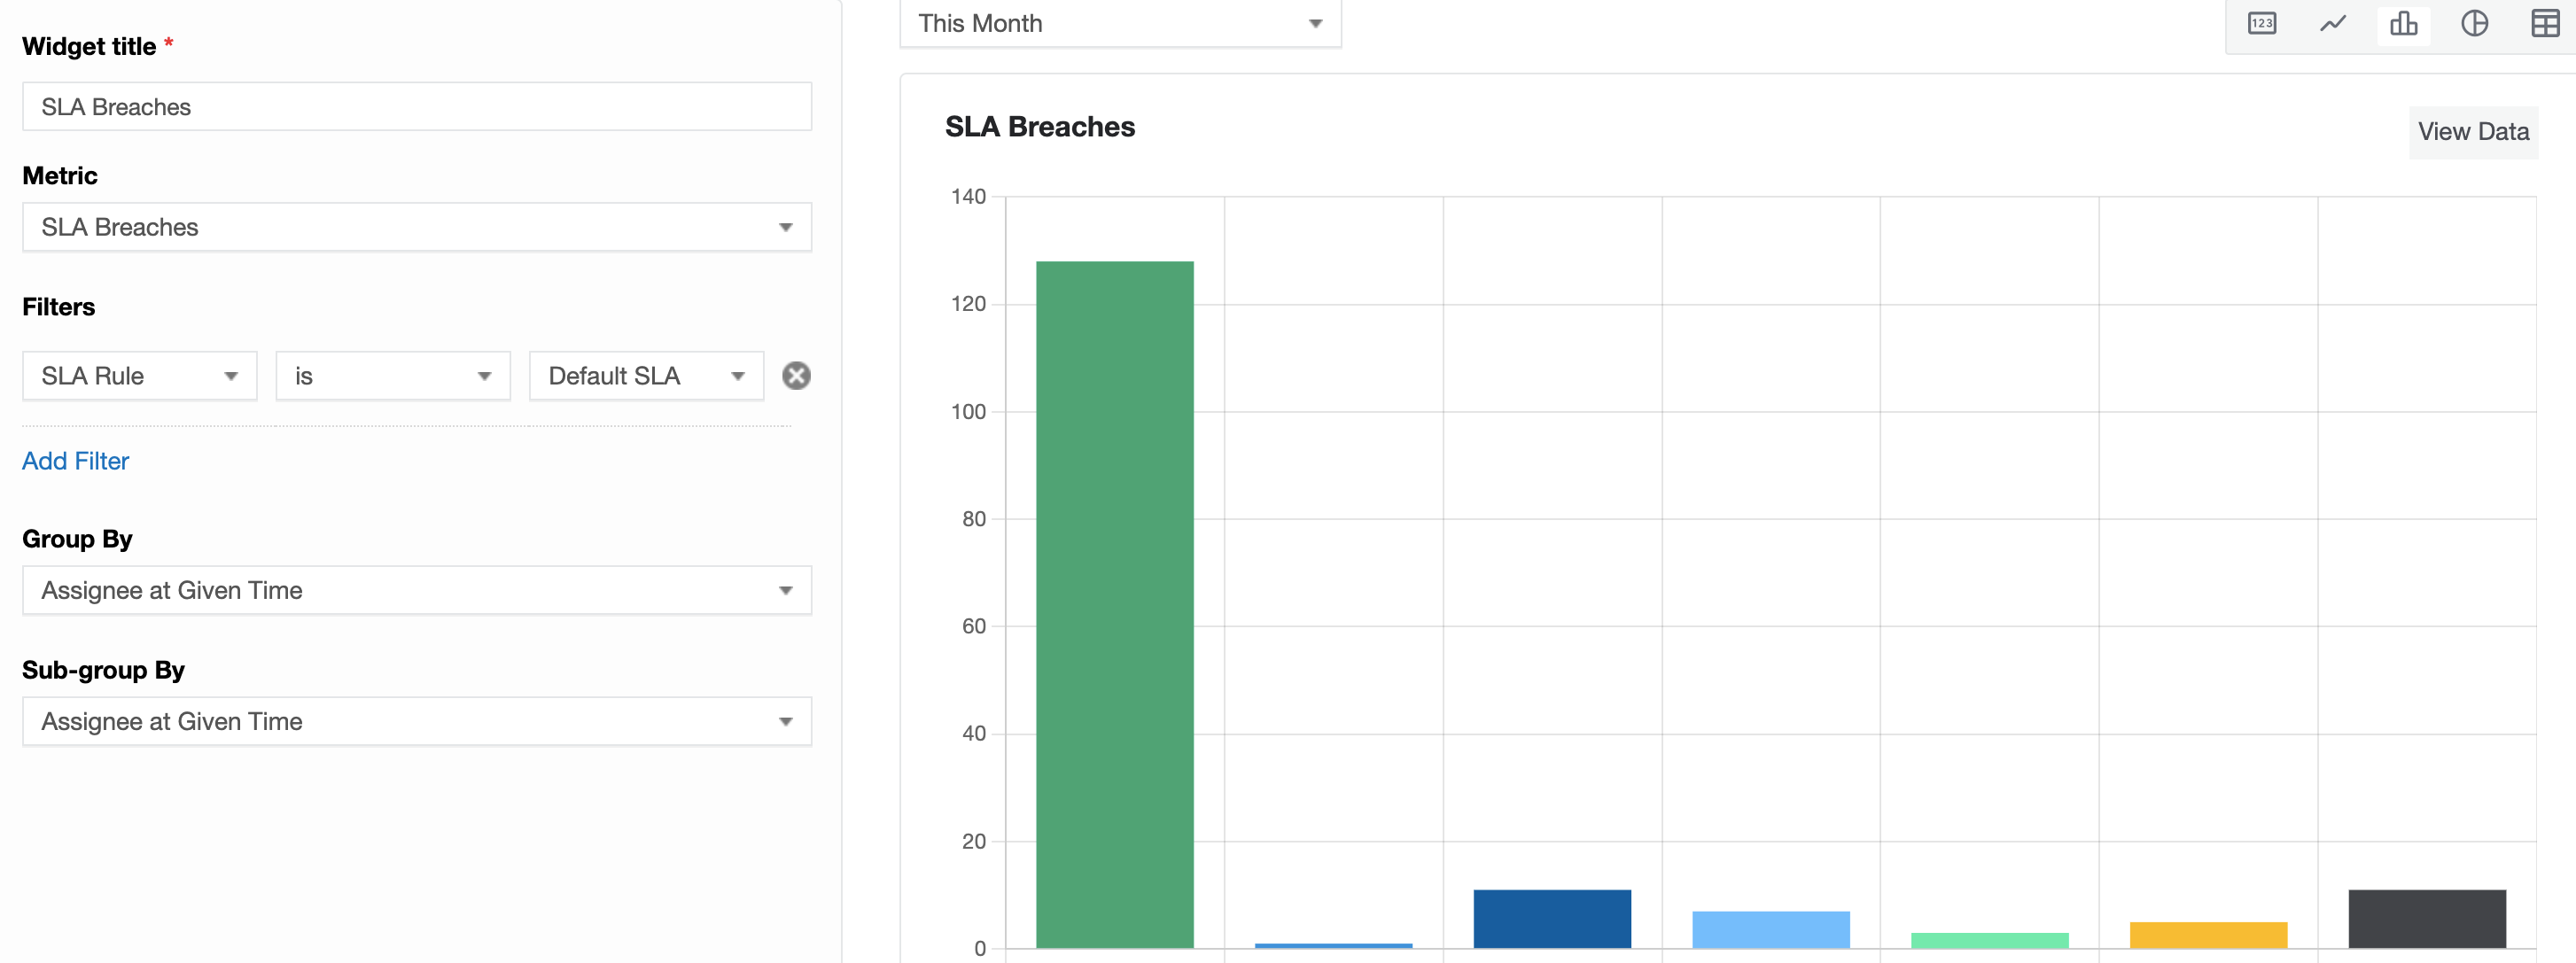
There isn't a single metric called "SLA" in Analytics today — SLA performance per agent is best read as two widgets:
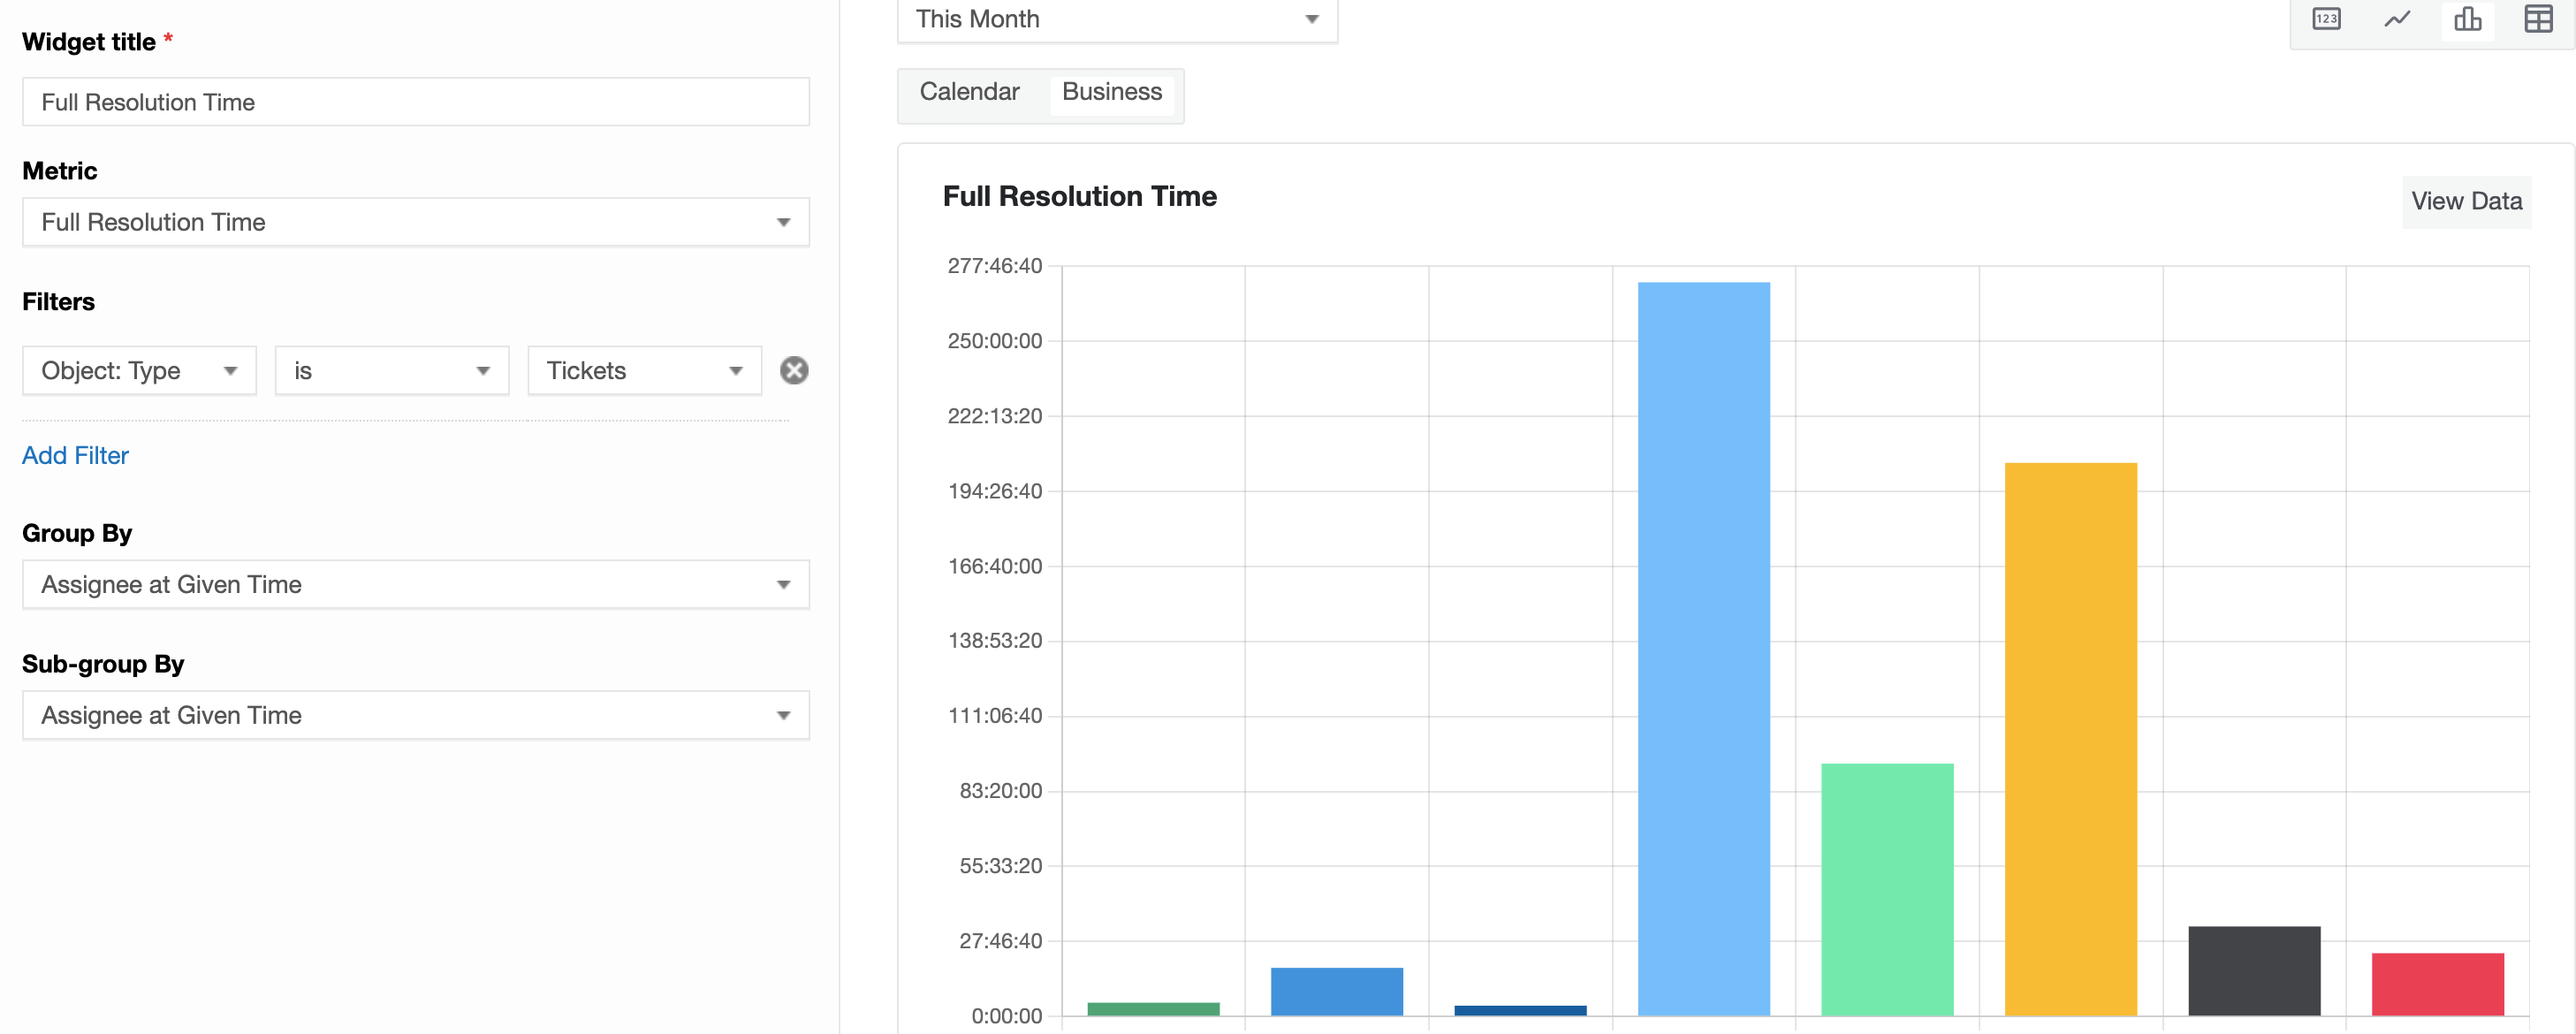
SLA Breaches shows how often an agent's tickets breach SLA, and Full Resolution Time shows how fast that agent actually resolves tickets.
Together they tell you what a single "SLA score" would try to summarize.
| Setting | Widget A — SLA breaches by agent | Widget B — Resolution speed by agent |
|---|---|---|
| Metric | SLA Breaches | Full Resolution Time |
| Filters | Object: SLA Rule is [your SLA rule] | Object: Type is Ticket |
| Group By | Assignee at Given Time | Assignee at Given Time |
| Visualization | Bar | Table |
| Time mode | — | Business |
Tip: put both widgets in the same report, next to each other — an agent with low breach count and low average resolution time is genuinely fast; an agent with a low breach count but a high resolution time may just be working tickets that don't carry a strict SLA rule.
Example 3 — "What is the average First Reply Time by team?"
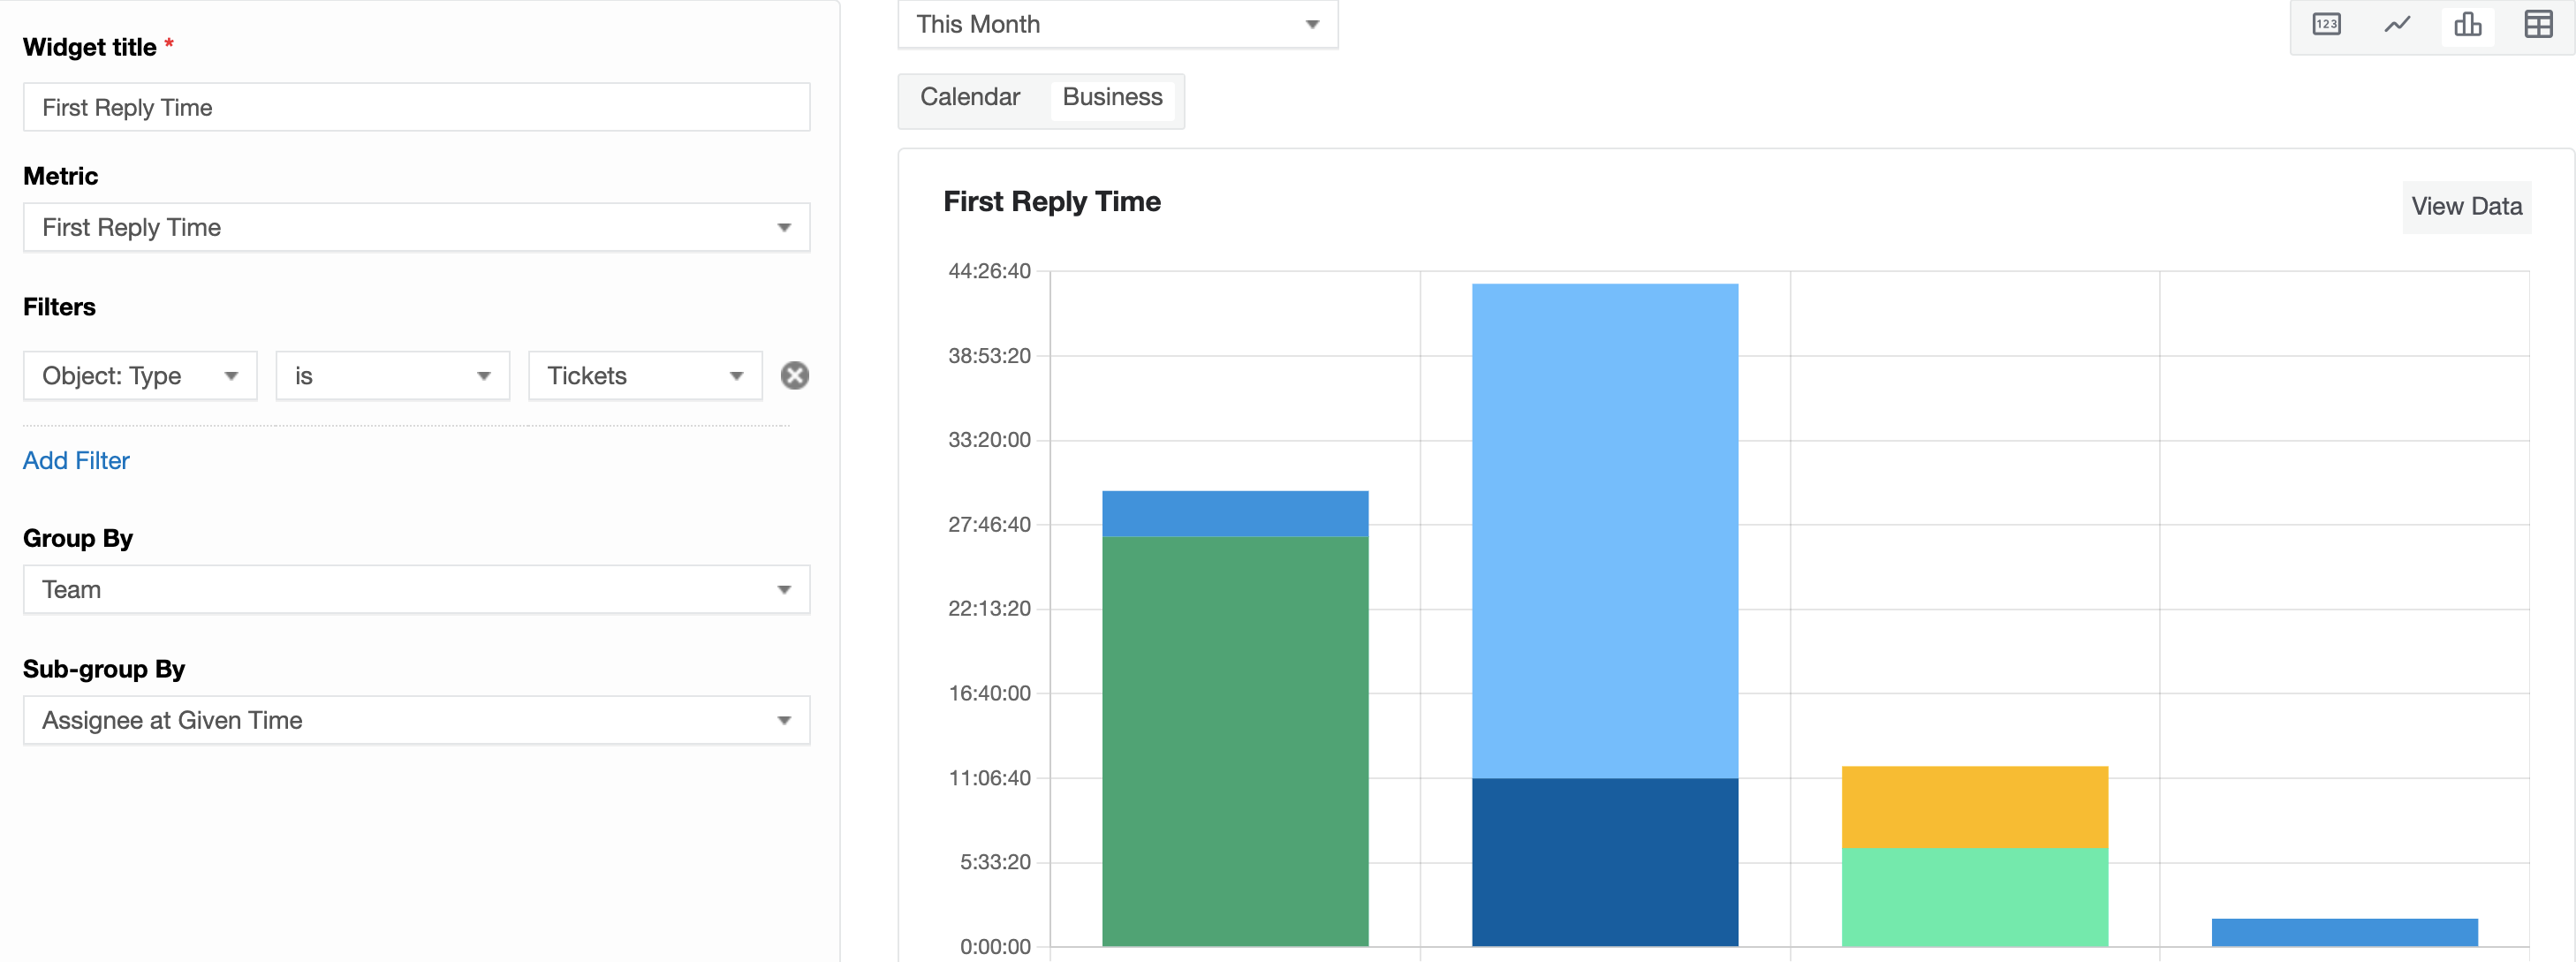
Best practice: First Reply Time is almost always the metric quoted in SLA agreements, so measure it in Business time — otherwise a ticket that came in at 11 PM and got a reply at 9 AM will show as a 10-hour reply time instead of a near-instant one at the start of the shift.
| Setting | Value |
|---|---|
| Metric | First Reply Time |
| Filters | Object: Type is Ticket |
| Group By | Team |
| Visualization | Bar |
| Time mode | Business |
Tip: duplicate this widget with Group By set to Days instead of Team to see whether reply times are drifting over time, independent of which team is involved.
Example 4 — "What's the average CSAT score per agent?"
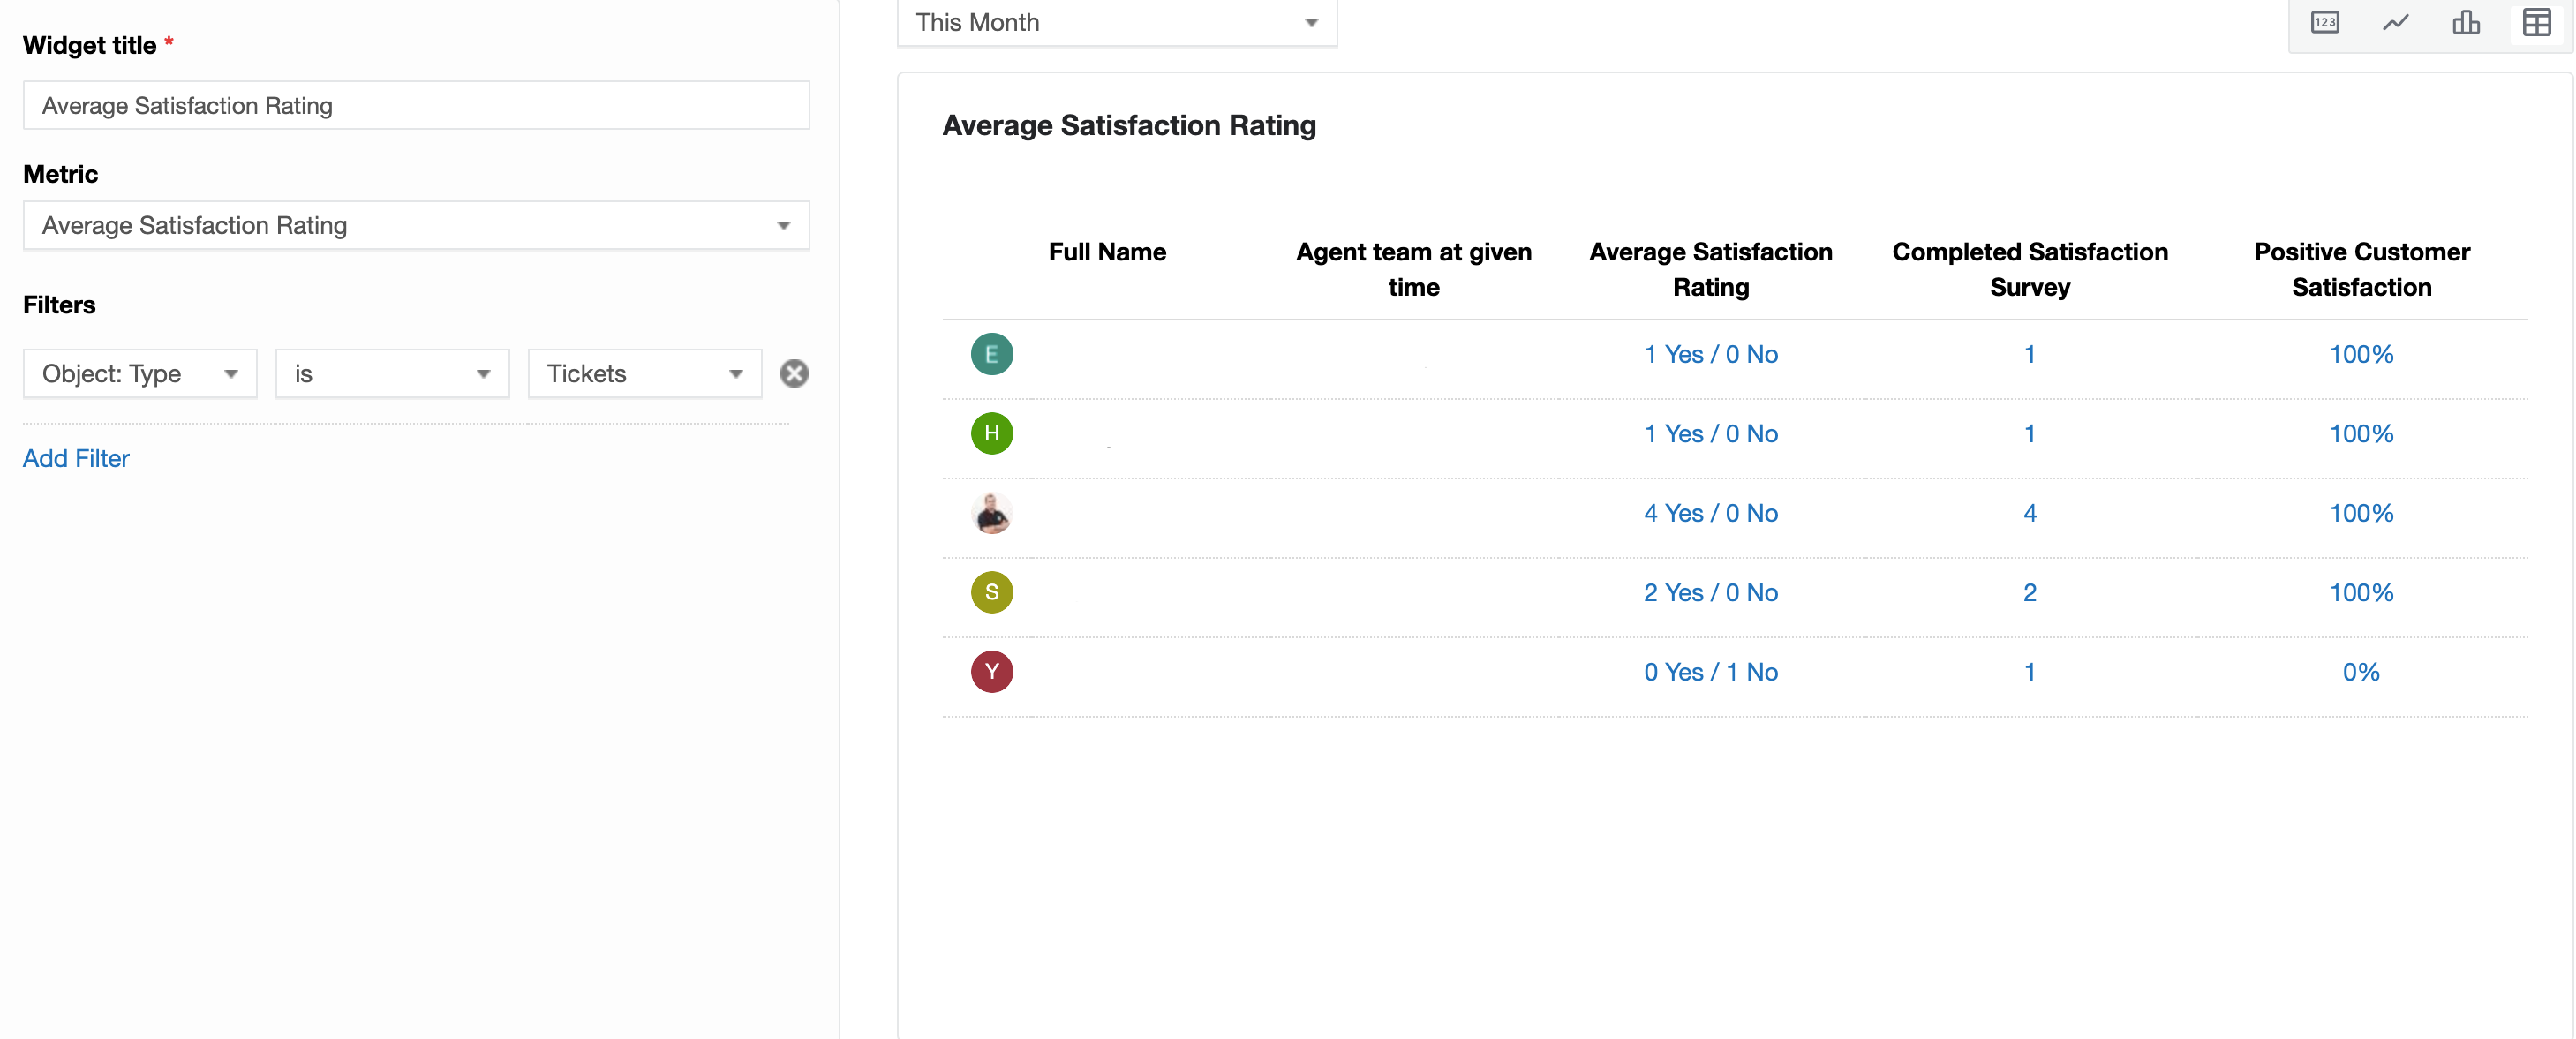
Best practice: pair the average score with the number of ratings it's based on — a 5.0 average from 2 surveys is not the same signal as a 4.2 average from 200 surveys, and showing only the average invites the wrong conclusion.
| Setting | Widget A — Average score | Widget B — Survey volume |
|---|---|---|
| Metric | Average Satisfaction Survey | Completed Satisfaction Surveys |
| Filters | Object: Community is [your community] | Same |
| Group By | Assignee at Given Time | Assignee at Given Time |
| Visualization | Table | Table |
Tip: sort the Table by survey volume first — an agent at the bottom of the CSAT ranking with only 3 ratings needs more data before you act on it, not immediate attention.
Example 5 — "Which tickets are currently waiting on an agent, unanswered?"
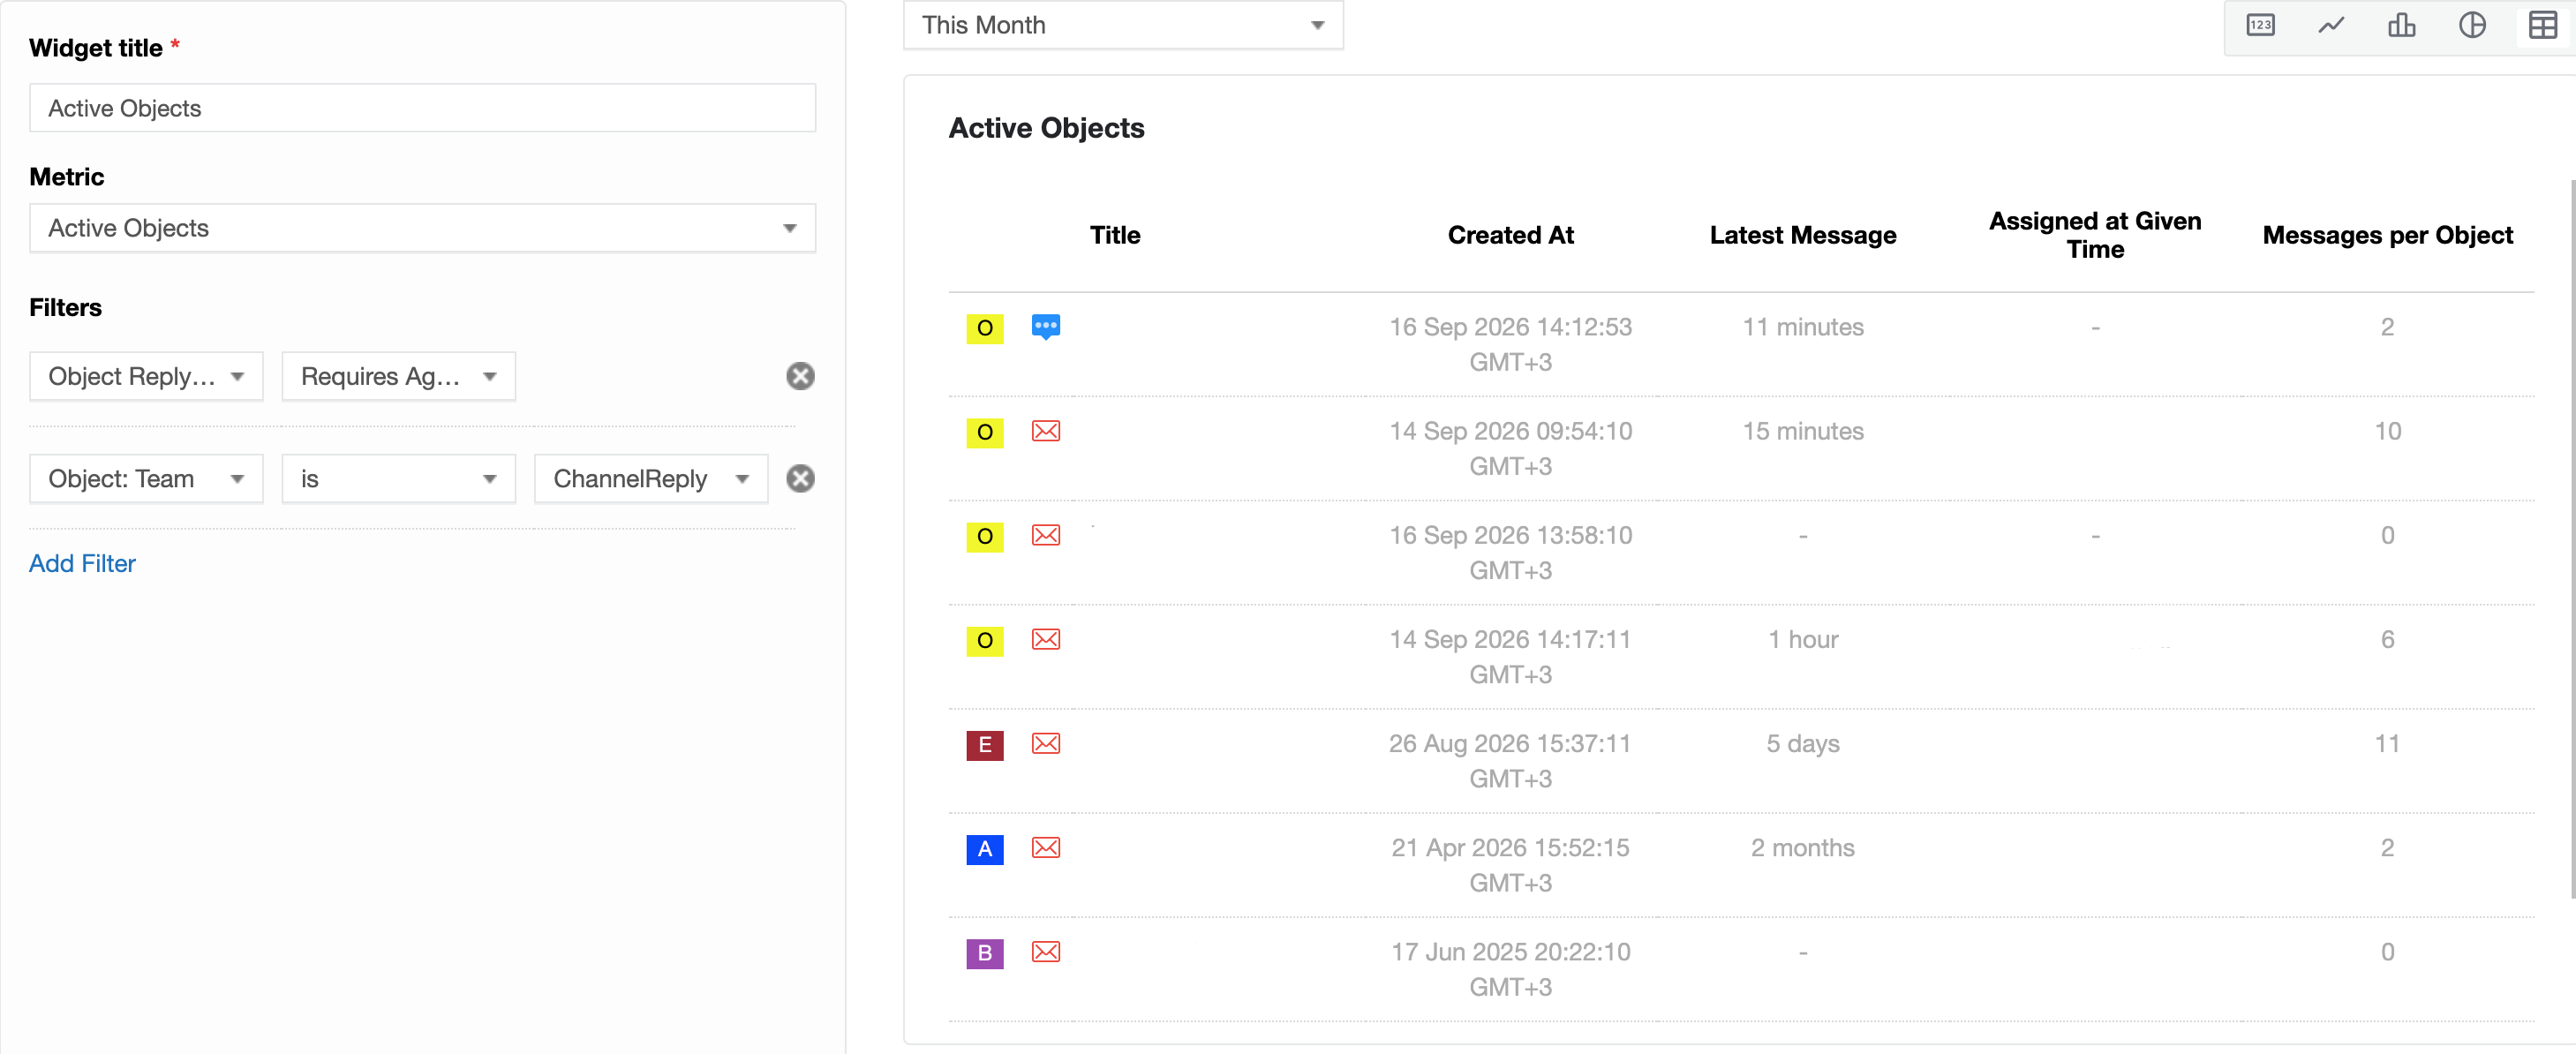
Best practice: this is a live risk list, not a historical chart — you want the actual tickets, not a count, so you can act on them today. Keep it as a Table without grouping and filter it down to one team or queue at a time so the list stays short enough to actually work through.
| Setting | Value |
|---|---|
| Metric | Active Object |
| Filters | Object Reply Status: Requires Agent's Replyt; Object: Team is [your team] |
| Group By | — (Table lists individual tickets, not a grouped count) |
| Visualization | Table |
Tip: pin this widget at the top of a "Today" report rather than a monthly one — its value is in being checked and cleared throughout the day, not reviewed at month's end.
Sharing and Permissions
By default, only Administrators can manage Analytics reports.
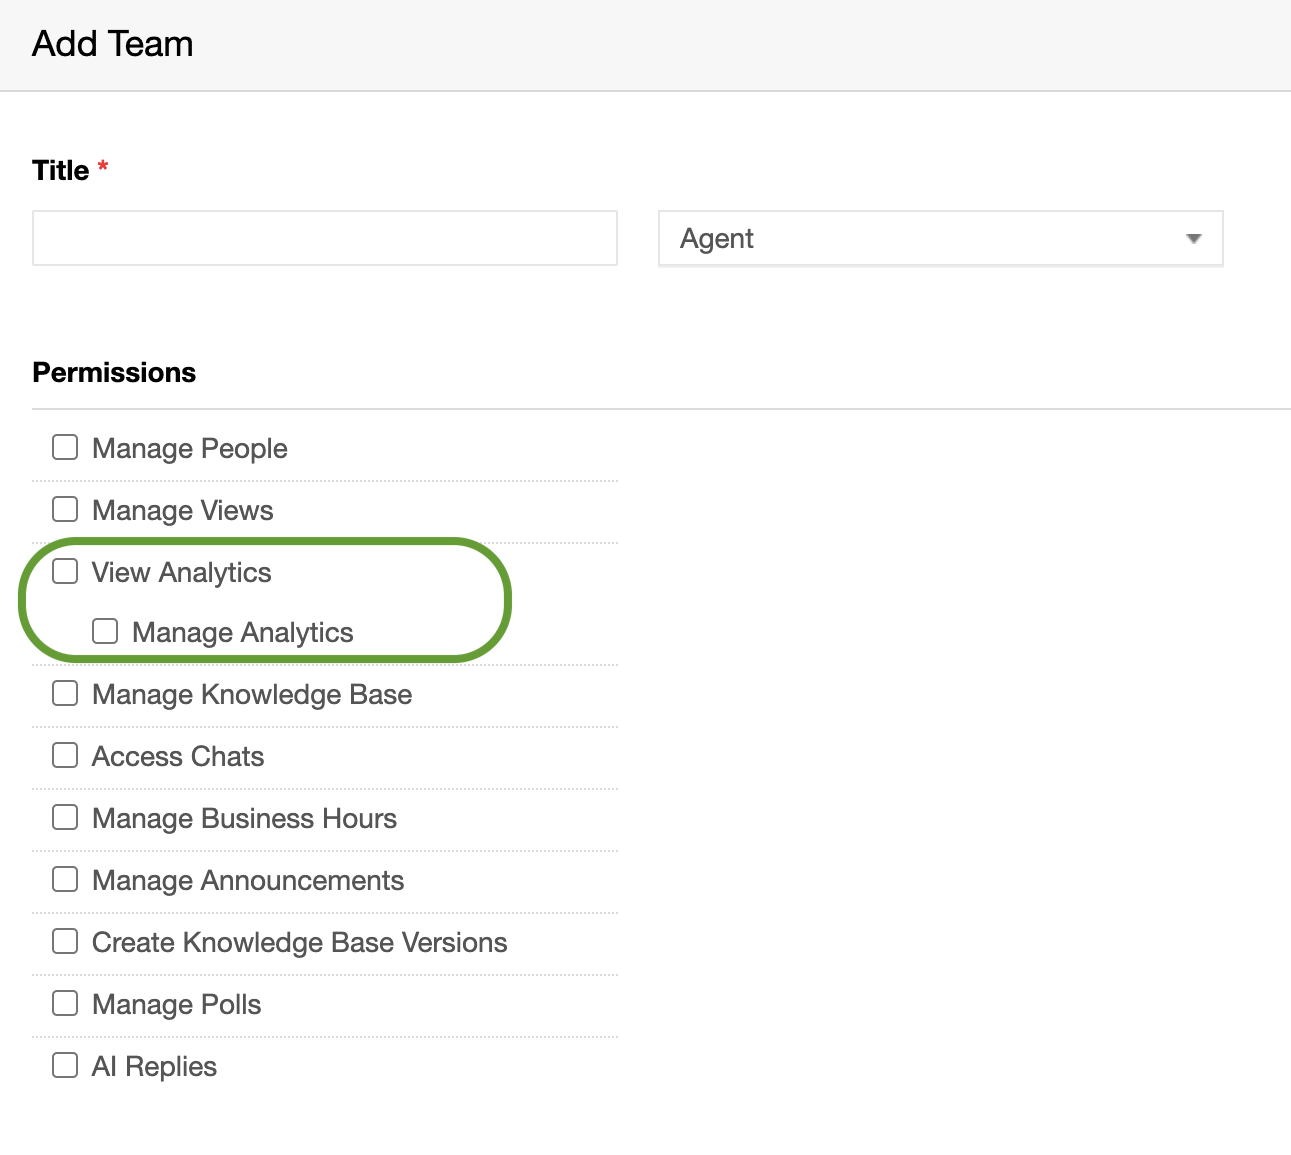
You can customize which agents have access to View or Edit Analytic reports in User Permissions.
- Navigate to User Profile → Permissions.
- Enable or disable the View Analytics or Manage Analytics permissions as needed.
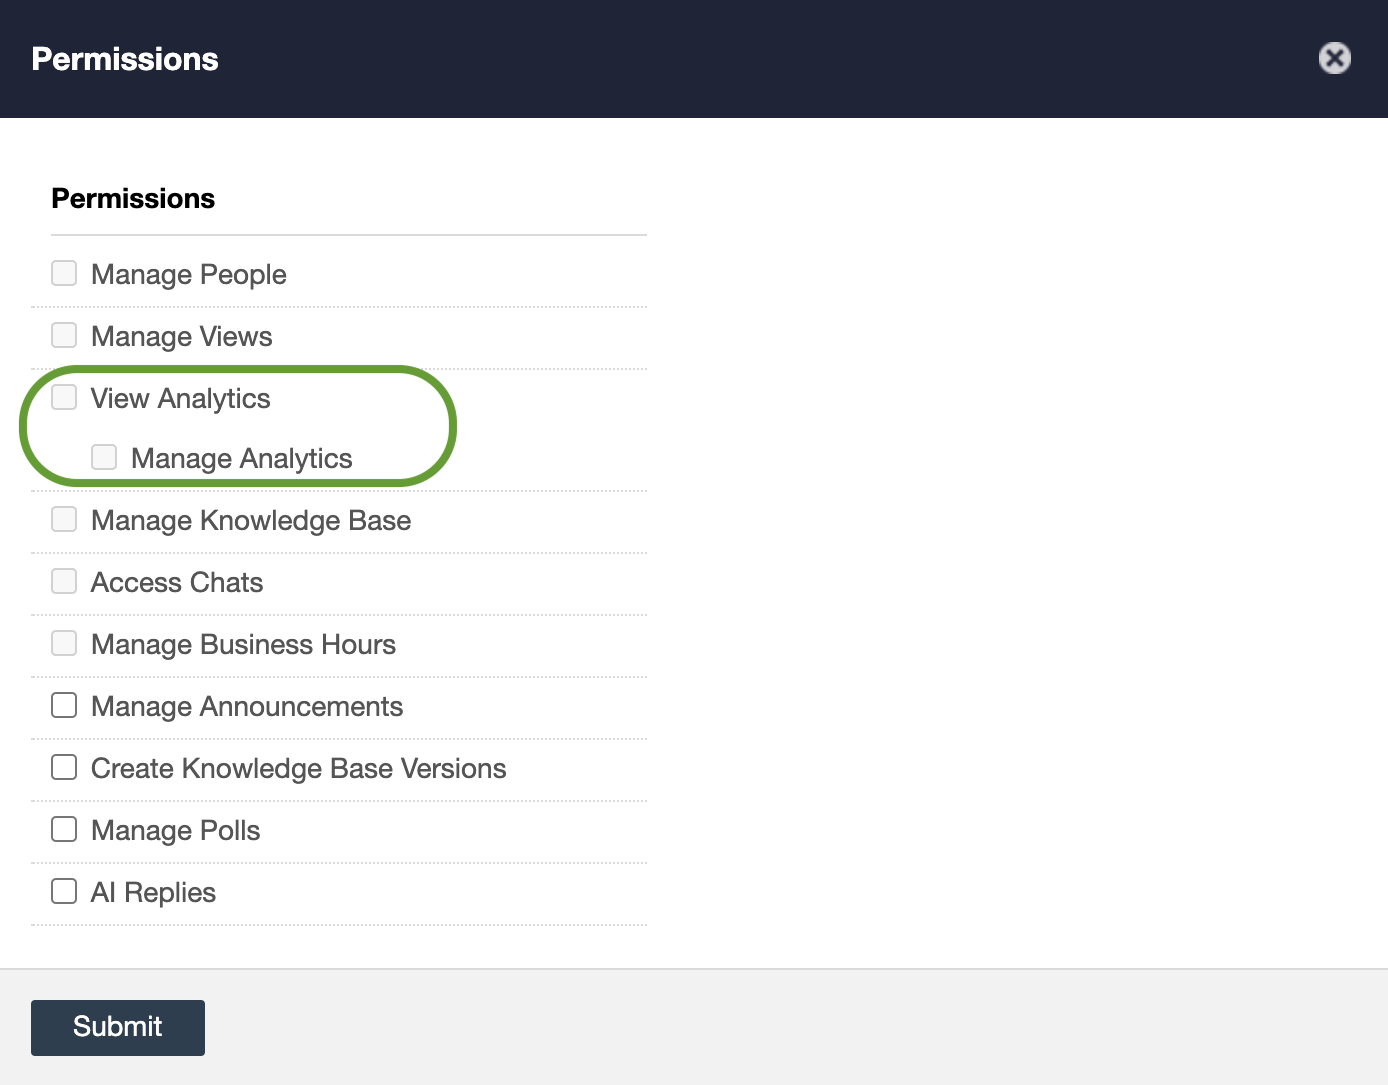
Analytics permissions can be managed on the team level as well.
When creating a new team, select the required permissions to grant or restrict access to Analytics. Once users are added to the team, their permissions will be updated automatically based on the team's settings.